Insights and charts
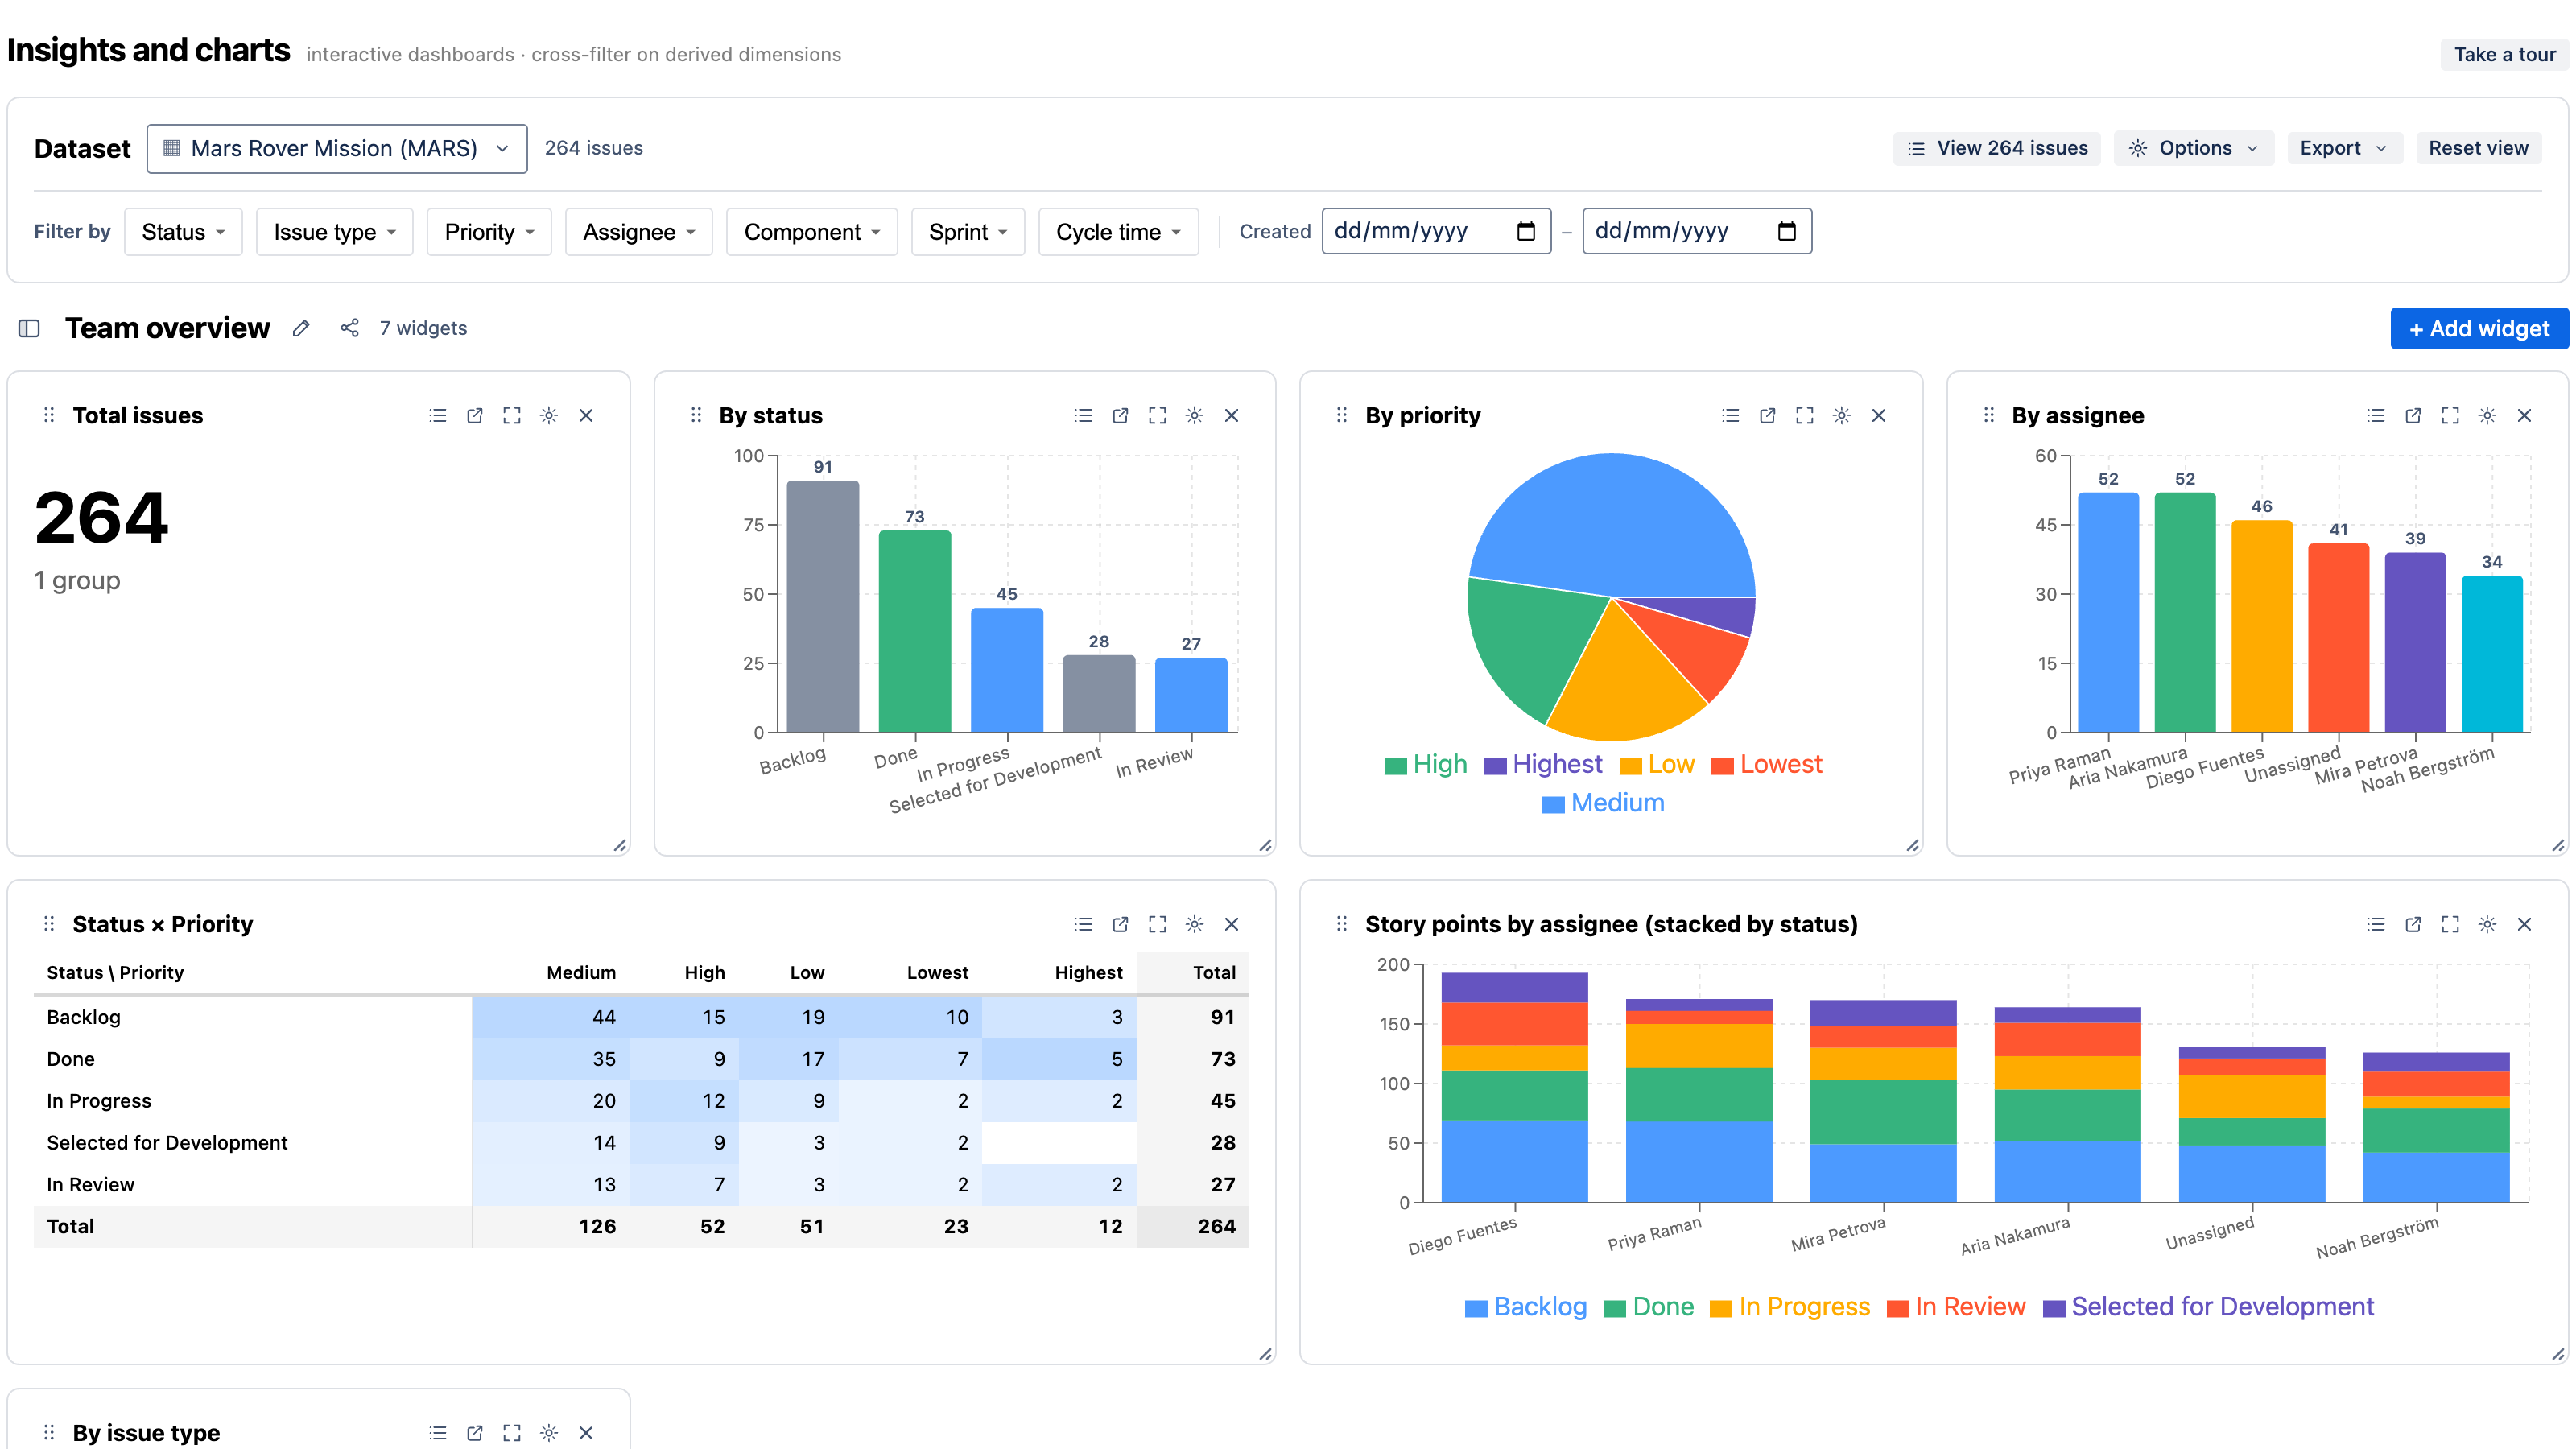
Insights and charts is an Atlassian Forge app that turns Jira into a set of interactive, cross-filterable dashboards. Build charts over your issues, click any segment to refilter the whole page, and group by derived metrics like cycle time and time-in-status that aren't even fields in Jira — all without writing a query language, and all inside Atlassian's infrastructure.
Because it's built on Forge, your issue data, comments, and history never leave Atlassian's cloud. There are no external servers and no data egress. See Security.
What makes it different
Three things set Insights and charts apart from a typical Jira charting gadget:
-
Click-to-cross-filter. Click a bar, slice, or cell in any chart and every other widget on the dashboard refilters to match. Multi-select, see your selection as chips, and clear it in one click. This is linked brushing, not a separate filter gadget.
-
Derived metrics without a formula language. Cycle time, time-in-status, WIP/status aging, SLA state, and reopen count are precomputed from each issue's change history and exposed as first-class chart axes and filters — group by them, trend them, bucket them. No MDX, no scripting.
-
Runs on Atlassian. Pure Forge, no external egress. For security-sensitive teams this is a real difference from connected apps that copy your Jira data to a third-party cloud.
What you can build
- Team overview — issues by status, assignee, type, priority, with click-to-cross-filter.
- Cycle time & flow — cycle-time distribution, a control chart with p50/p85 lines, and lead-time KPIs.
- Time in status & WIP — average time in each status, current-status aging, and reopened issues.
- SLA & aging — % within SLA, breach counts, and SLA state by priority against a target you set.
- Flow history — open-issues-over-time and a Cumulative Flow Diagram reconstructed from change history.
- Velocity & burndown — committed-vs-completed per sprint and a sprint burndown from your Scrum board.
- Epics & story points — epic progress, % done, and points by assignee or epic.
- Dependencies & blockers — what's blocked, blocker aging, and a dependency matrix of group × group.
Each of these ships as a one-click template, or you can build your own from scratch. See Templates & recipes.
How it fits in Jira
Insights and charts appears in three places:
- A full-page app under Apps → Insights and charts in the Jira navigation (and a per-project page).
- A native dashboard gadget you can add to any Jira dashboard, which can also act as a page-wide selection filter for other gadgets.
Get started
- Getting started — install from the Marketplace and build your first dashboard in about five minutes.
- Core concepts — dashboards, datasets, widgets, dimensions vs. measures, derived dimensions, and cross-filtering.
- Templates & recipes — a ready-made chart for every common Jira reporting question.