Getting Started
This guide takes you from installation to your first interactive dashboard. The whole process takes about five minutes.
Prerequisites
- A Jira Cloud instance (Insights and charts is a Forge app and runs only on Jira Cloud).
- Jira administrator access to install the app. Once installed, anyone with access to the app can build dashboards.
Step 1: Install from the Marketplace
- Open the Atlassian Marketplace and search for "Insights and charts".
- Click Get it now and select your Jira instance.
- Review the permissions and click Install. The app only requests read access to your Jira work plus app storage — see Security for the full list.
After installation you'll find it in the Jira navigation under Apps → Insights and charts.
Step 2: Open the app
Open Apps → Insights and charts. The first time you arrive, a short guided tour points out where to start. The product onboards you in context — one tour when you first land, another the first time you open a dashboard, and a third the first time you add a chart — so you learn by doing rather than reading a wall of text.
Click Take a tour in the top-right of the app to replay the walkthrough for wherever you currently are.
Step 3: Create a dashboard
A dashboard is a saved page of charts. To create one:
- Click the + in the left rail to start a blank dashboard, or
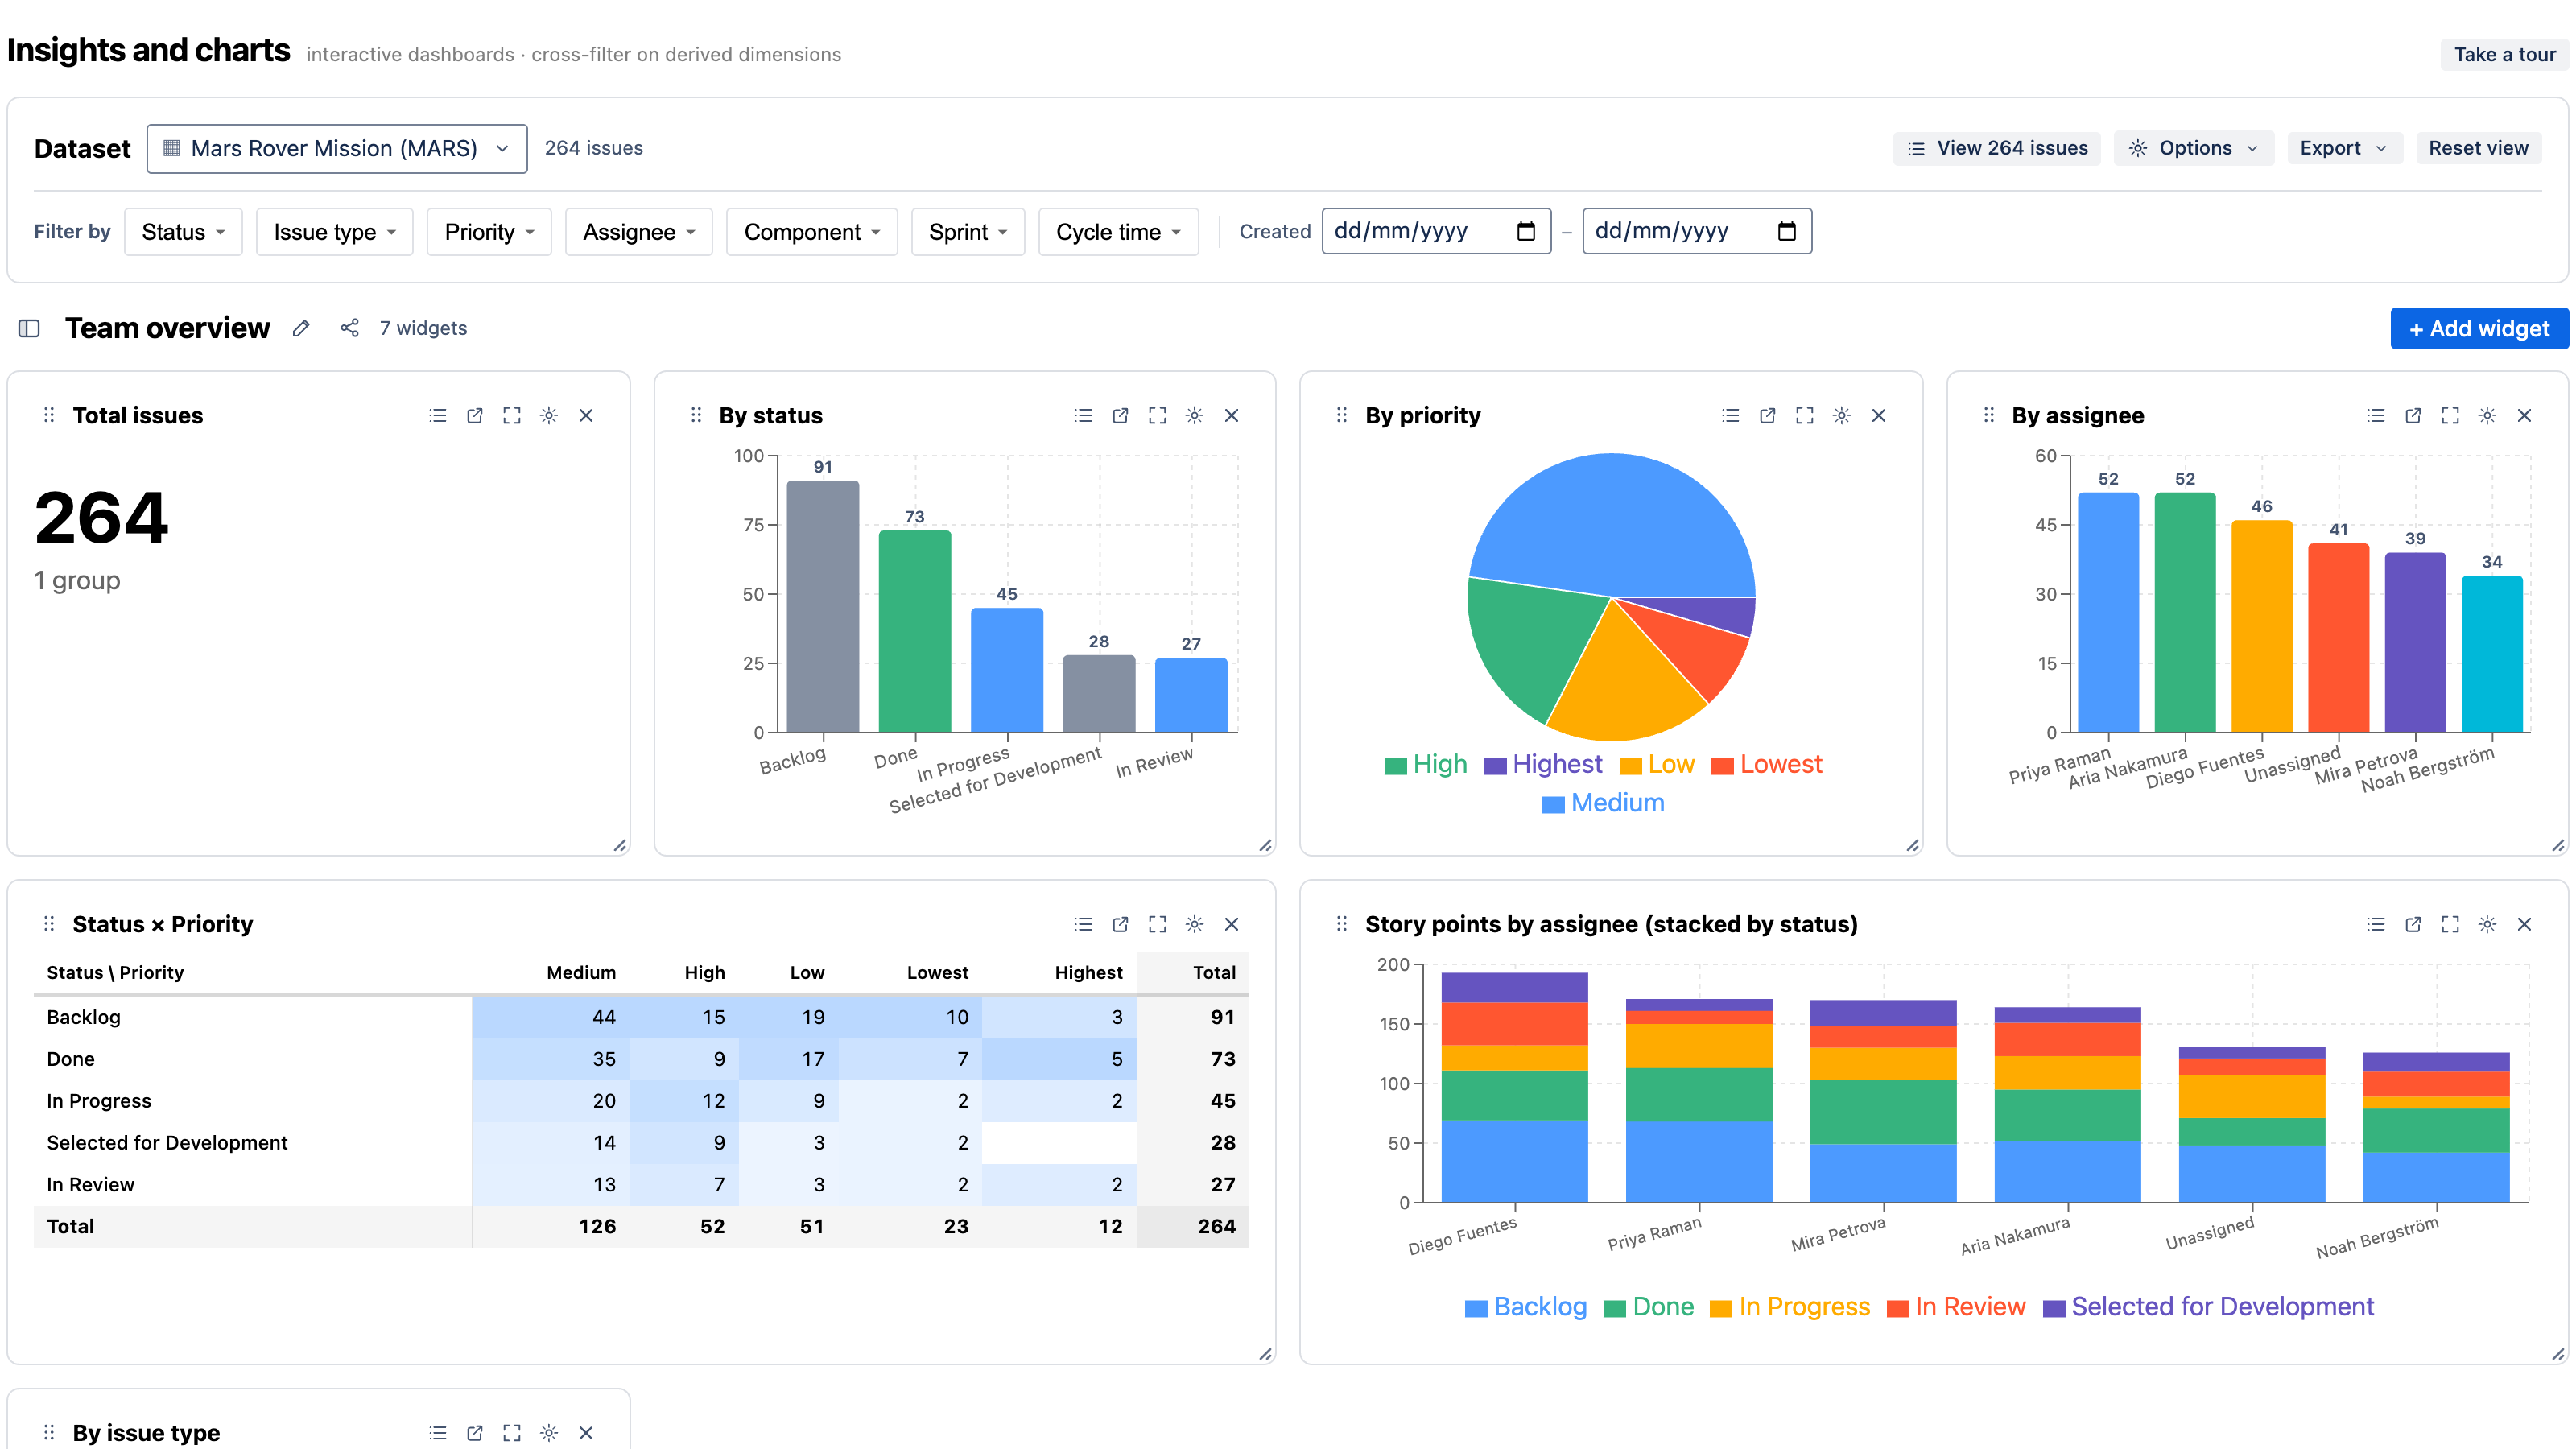
- Pick a template below it (Team overview, Cycle time & flow, Velocity & burndown, and more) for a ready-made set of charts.
If you start from a template, skip ahead to Explore & cross-filter — the template already includes charts.
Step 4: Add a dataset
A dataset is the set of issues every chart on the dashboard reads. A new dashboard has none, so add one first — click Add a dataset and choose a source:
- Project — all issues in a Jira project (it also unlocks per-project history and rollups).
- Agile board — a Scrum or Kanban board (required for velocity and sprint burndown).
- Saved filter — any Jira saved filter; its JQL becomes the dataset.
- Custom JQL — write your own JQL, with autocomplete for fields, operators, and values.
See Datasets for the full reference.
Step 5: Add a chart
Click + Add widget. You have two paths:
- Start from a use case — pick a ready-made recipe from the gallery on the right (e.g. "Issues by status", "Cycle-time control chart", "Velocity"). It loads into the builder so you can tweak before adding.
- Build your own — choose a chart type, then set what to group by (the dimension) and what to measure (count, sum of story points, median cycle time, and so on).
Click + Add widget to drop it on the dashboard. See Adding charts.
Step 6: Explore & cross-filter
This is where it gets interactive:
- Click any segment — a bar, a pie slice, a cell — and every chart on the dashboard refilters to that selection. Click more segments to multi-select; your selection shows as chips you can clear.
- Drill down — charts with a hierarchy (e.g. issue type → status, or year → quarter → month → day) let you click in and follow a breadcrumb back out.
- Filter the whole dashboard from the filter bar at the top (status, type, priority, assignee, cycle-time bucket, created-date range).
See Cross-filtering & drill-down.
Step 7: Save & share
Dashboards auto-save as you edit. To share:
- Copy link to view (under Export) captures your current filters in the URL so a colleague opens the exact view you're looking at.
- Share the dashboard with specific people as viewers or editors, or mark it restricted so only invited people can open it.
See Sharing, export & gadgets.
What's next
- Core concepts — the mental model: dashboards, datasets, widgets, dimensions, measures, derived dimensions.
- Derived metrics — cycle time, time-in-status, WIP aging, SLA, and reopens.
- Templates & recipes — a recipe for every common reporting question.