Cross-filtering & drill-down
This is what makes Insights and charts interactive rather than a wall of static gadgets.
Click to cross-filter
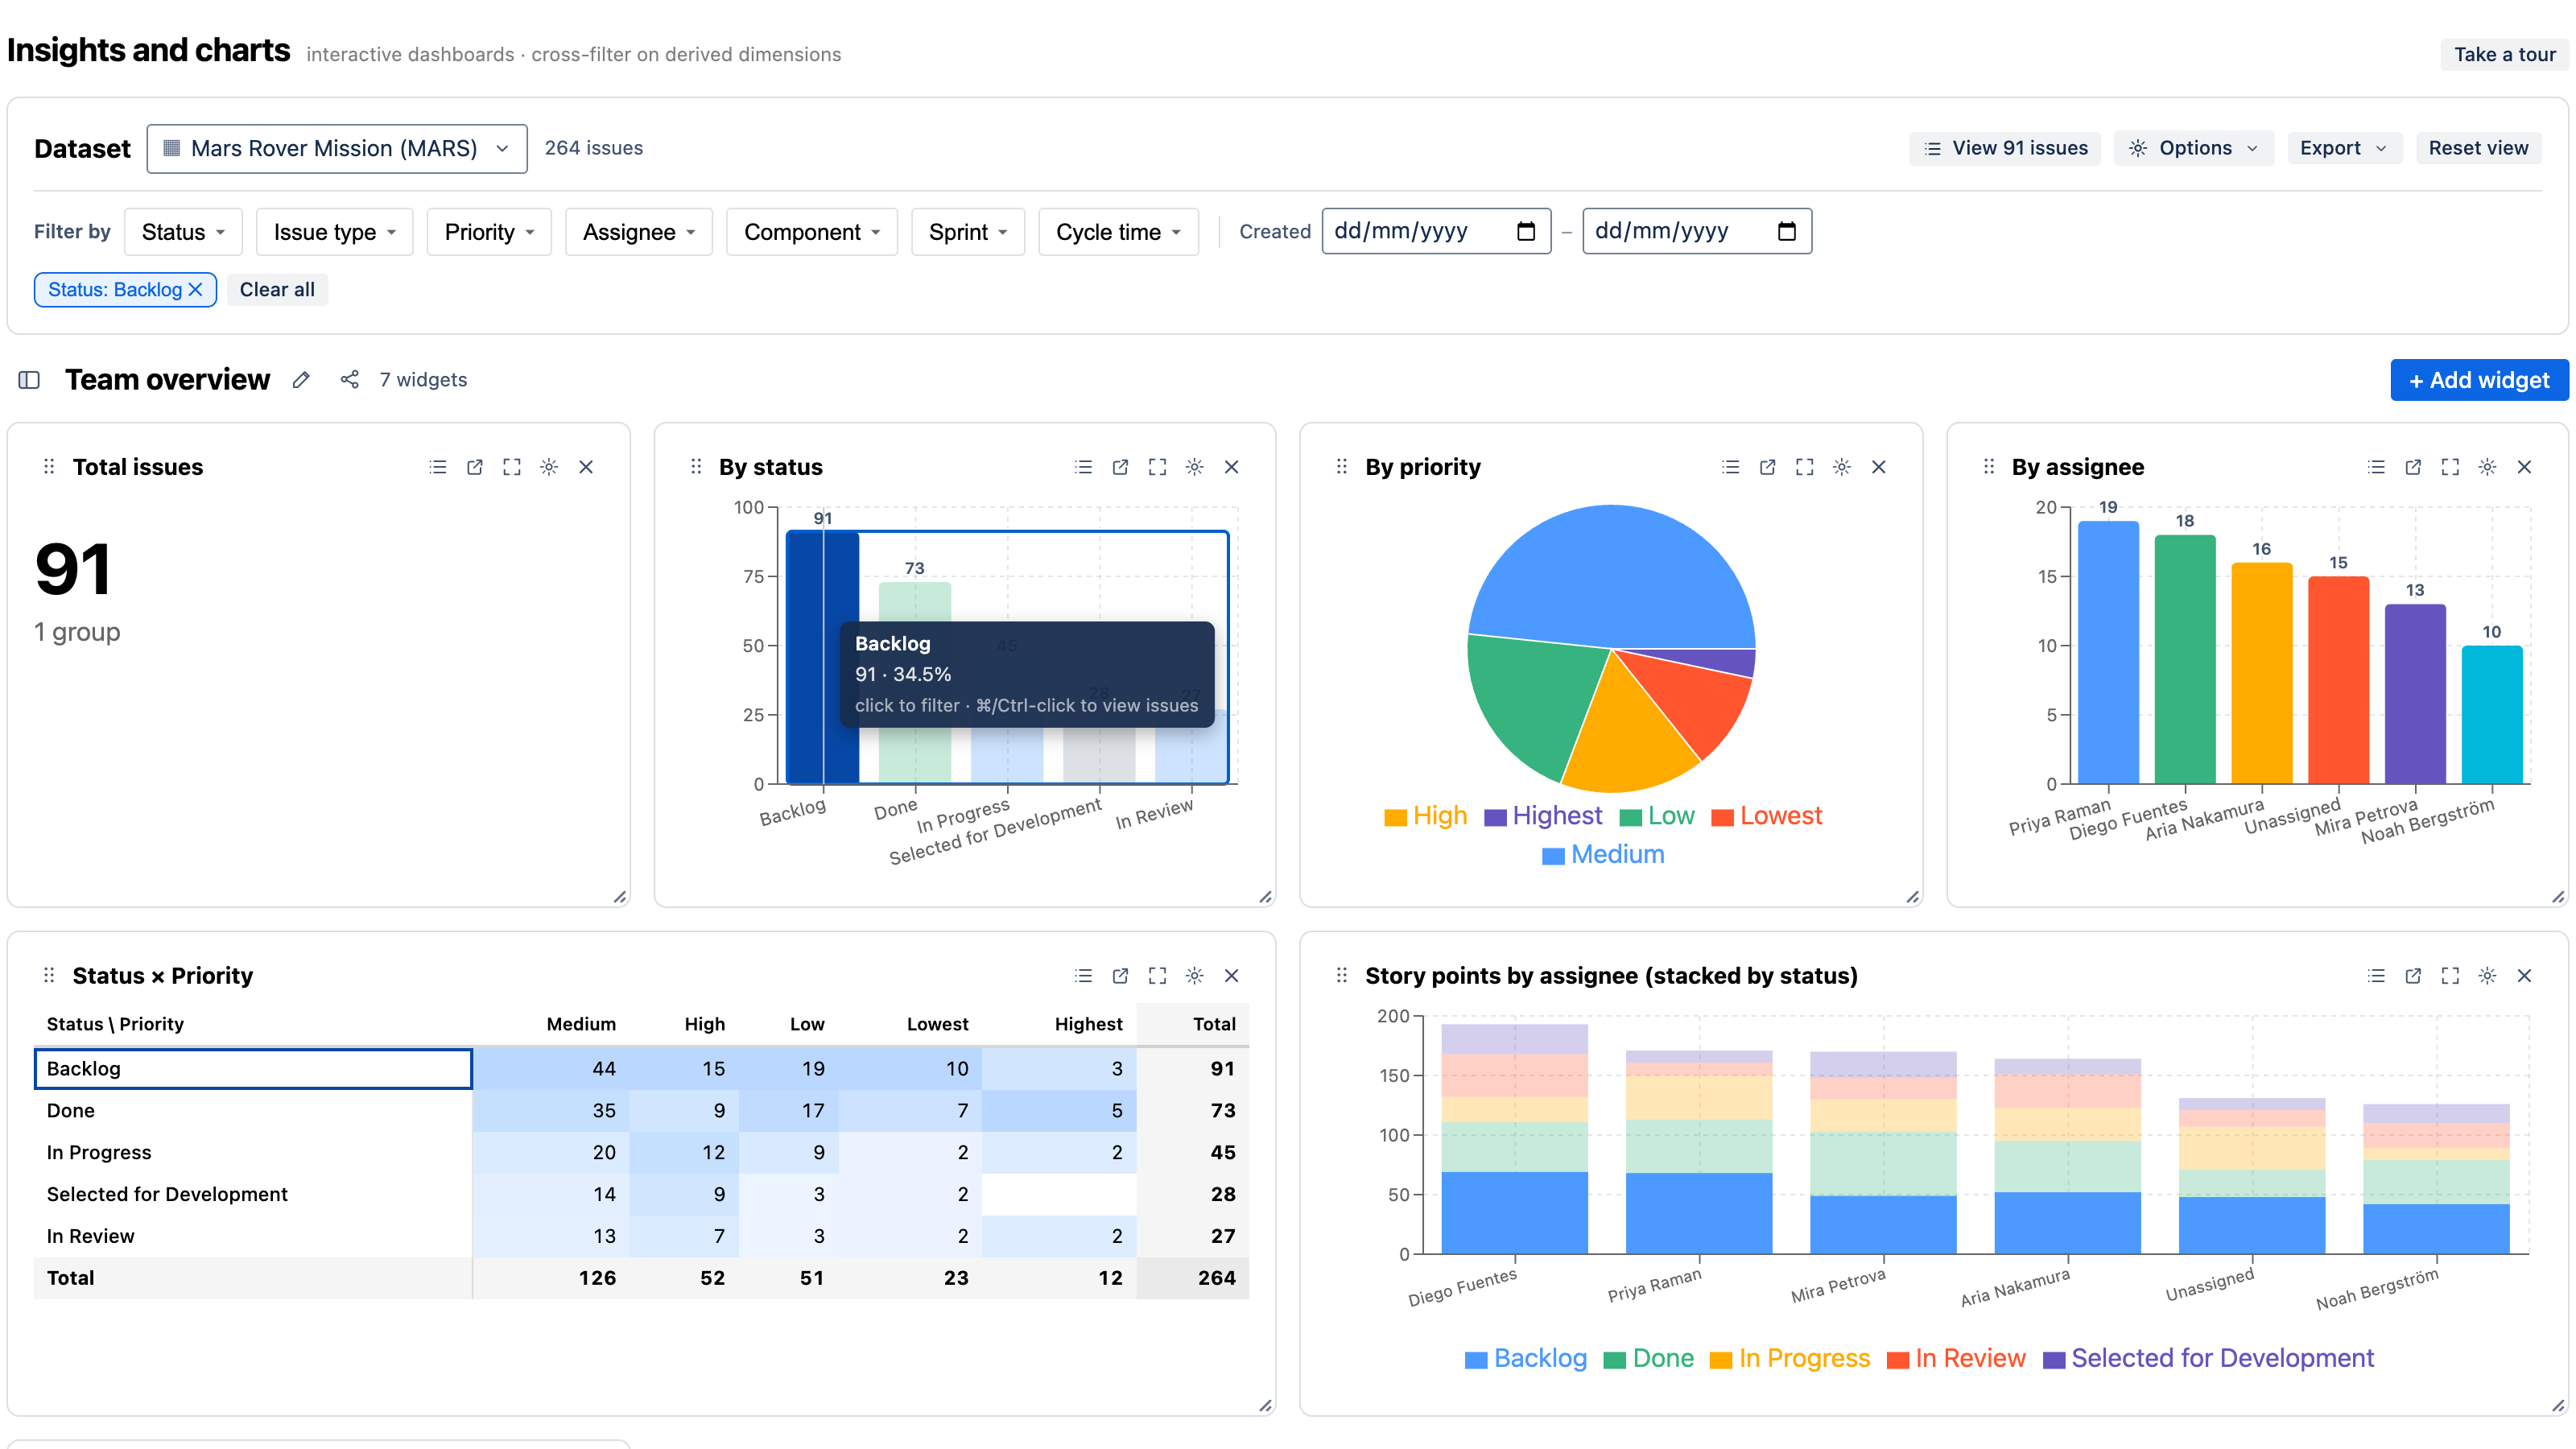
Click any segment in a chart — a bar, a pie slice, a stacked sub-bar, a pivot cell — and every other widget on the dashboard refilters to that selection. Click a second segment to multi-select. Your active selection appears as chips above the charts; remove one by clicking its ×, or clear everything at once.
This is linked brushing: the chart you clicked becomes a filter for the whole page, so you can answer "of the blocked issues, how are they split by assignee, and what's their cycle time?" in three clicks, without writing a query.
Two things narrow a dashboard, and they stay visually distinct:
- Scope filters (the filter bar) deliberately narrow the whole dashboard — solid chips.
- Cross-filter (clicking a chart) is exploratory — outlined chips.
Both can be active together. See Concepts.
Drill down through a hierarchy
Charts can define a drill-down hierarchy — an ordered set of dimensions you click into:
- Issue type → status — click a type to see its status breakdown.
- Date: year → quarter → month → day — click a year to zoom into quarters, then months, then days.
A breadcrumb shows where you are and lets you step back out. Set a widget's hierarchy in its ⚙ settings (see Adding charts).
The global filter bar
The bar at the top filters the whole dashboard independently of any chart click. It offers cascading template variables:
- Status, Issue type, Priority, Assignee, and Cycle-time bucket — multi-select dropdowns that cascade (choosing one narrows the others to what's still possible).
- Created-date range — restrict to issues created within a window.
Selections here apply to every widget and combine with any cross-filter.
See the issues behind a chart
Numbers are only useful if you can get to the issues:
- Click View N issues to open the list of issues behind the current view (all your scope + cross-filters applied).
- Drill into a single segment to open just those issues.
The issue list opens in-app in a drawer, so you stay on your dashboard. From there you can jump to any issue in Jira.
Reset
Reset view clears all scope filters, cross-filter selections, and the date range, returning the dashboard to its default.
Next
- Derived metrics — the dimensions worth cross-filtering on.
- Sharing, export & gadgets — a filtered view is shareable by link.