Derived metrics
The dimensions most people actually want to report on aren't Jira fields — how long did this take?, how long has it been stuck?, did it bounce backwards? Insights and charts computes these from each issue's change history and exposes them as first-class dimensions and filters: group by them, bucket them, trend them, and cross-filter on them, with no MDX or scripting.
This is the capability that client-side charting gadgets can't match — they can only group by fields that already exist on the issue.
How they're computed
- Change-log rollups. The app replays each issue's changelog into a small set of precomputed, indexed values — cycle-time days and bucket, current-status age, time spent in each status, and a reopen count. This runs as an on-demand computation when you first chart a project and is refreshed on a daily schedule, so charts read precomputed values instead of re-reading every issue's history on each load.
- Daily snapshots. For state-by-day charts (open issues over time, CFD), the app reconstructs the state of the backlog on each past day from the same change history.
The rollups and history are per-project, so derived-metric and flow-history charts need a project (or agile-board) dataset, not an arbitrary cross-project JQL. See Datasets.
The derived dimensions
Cycle / lead time
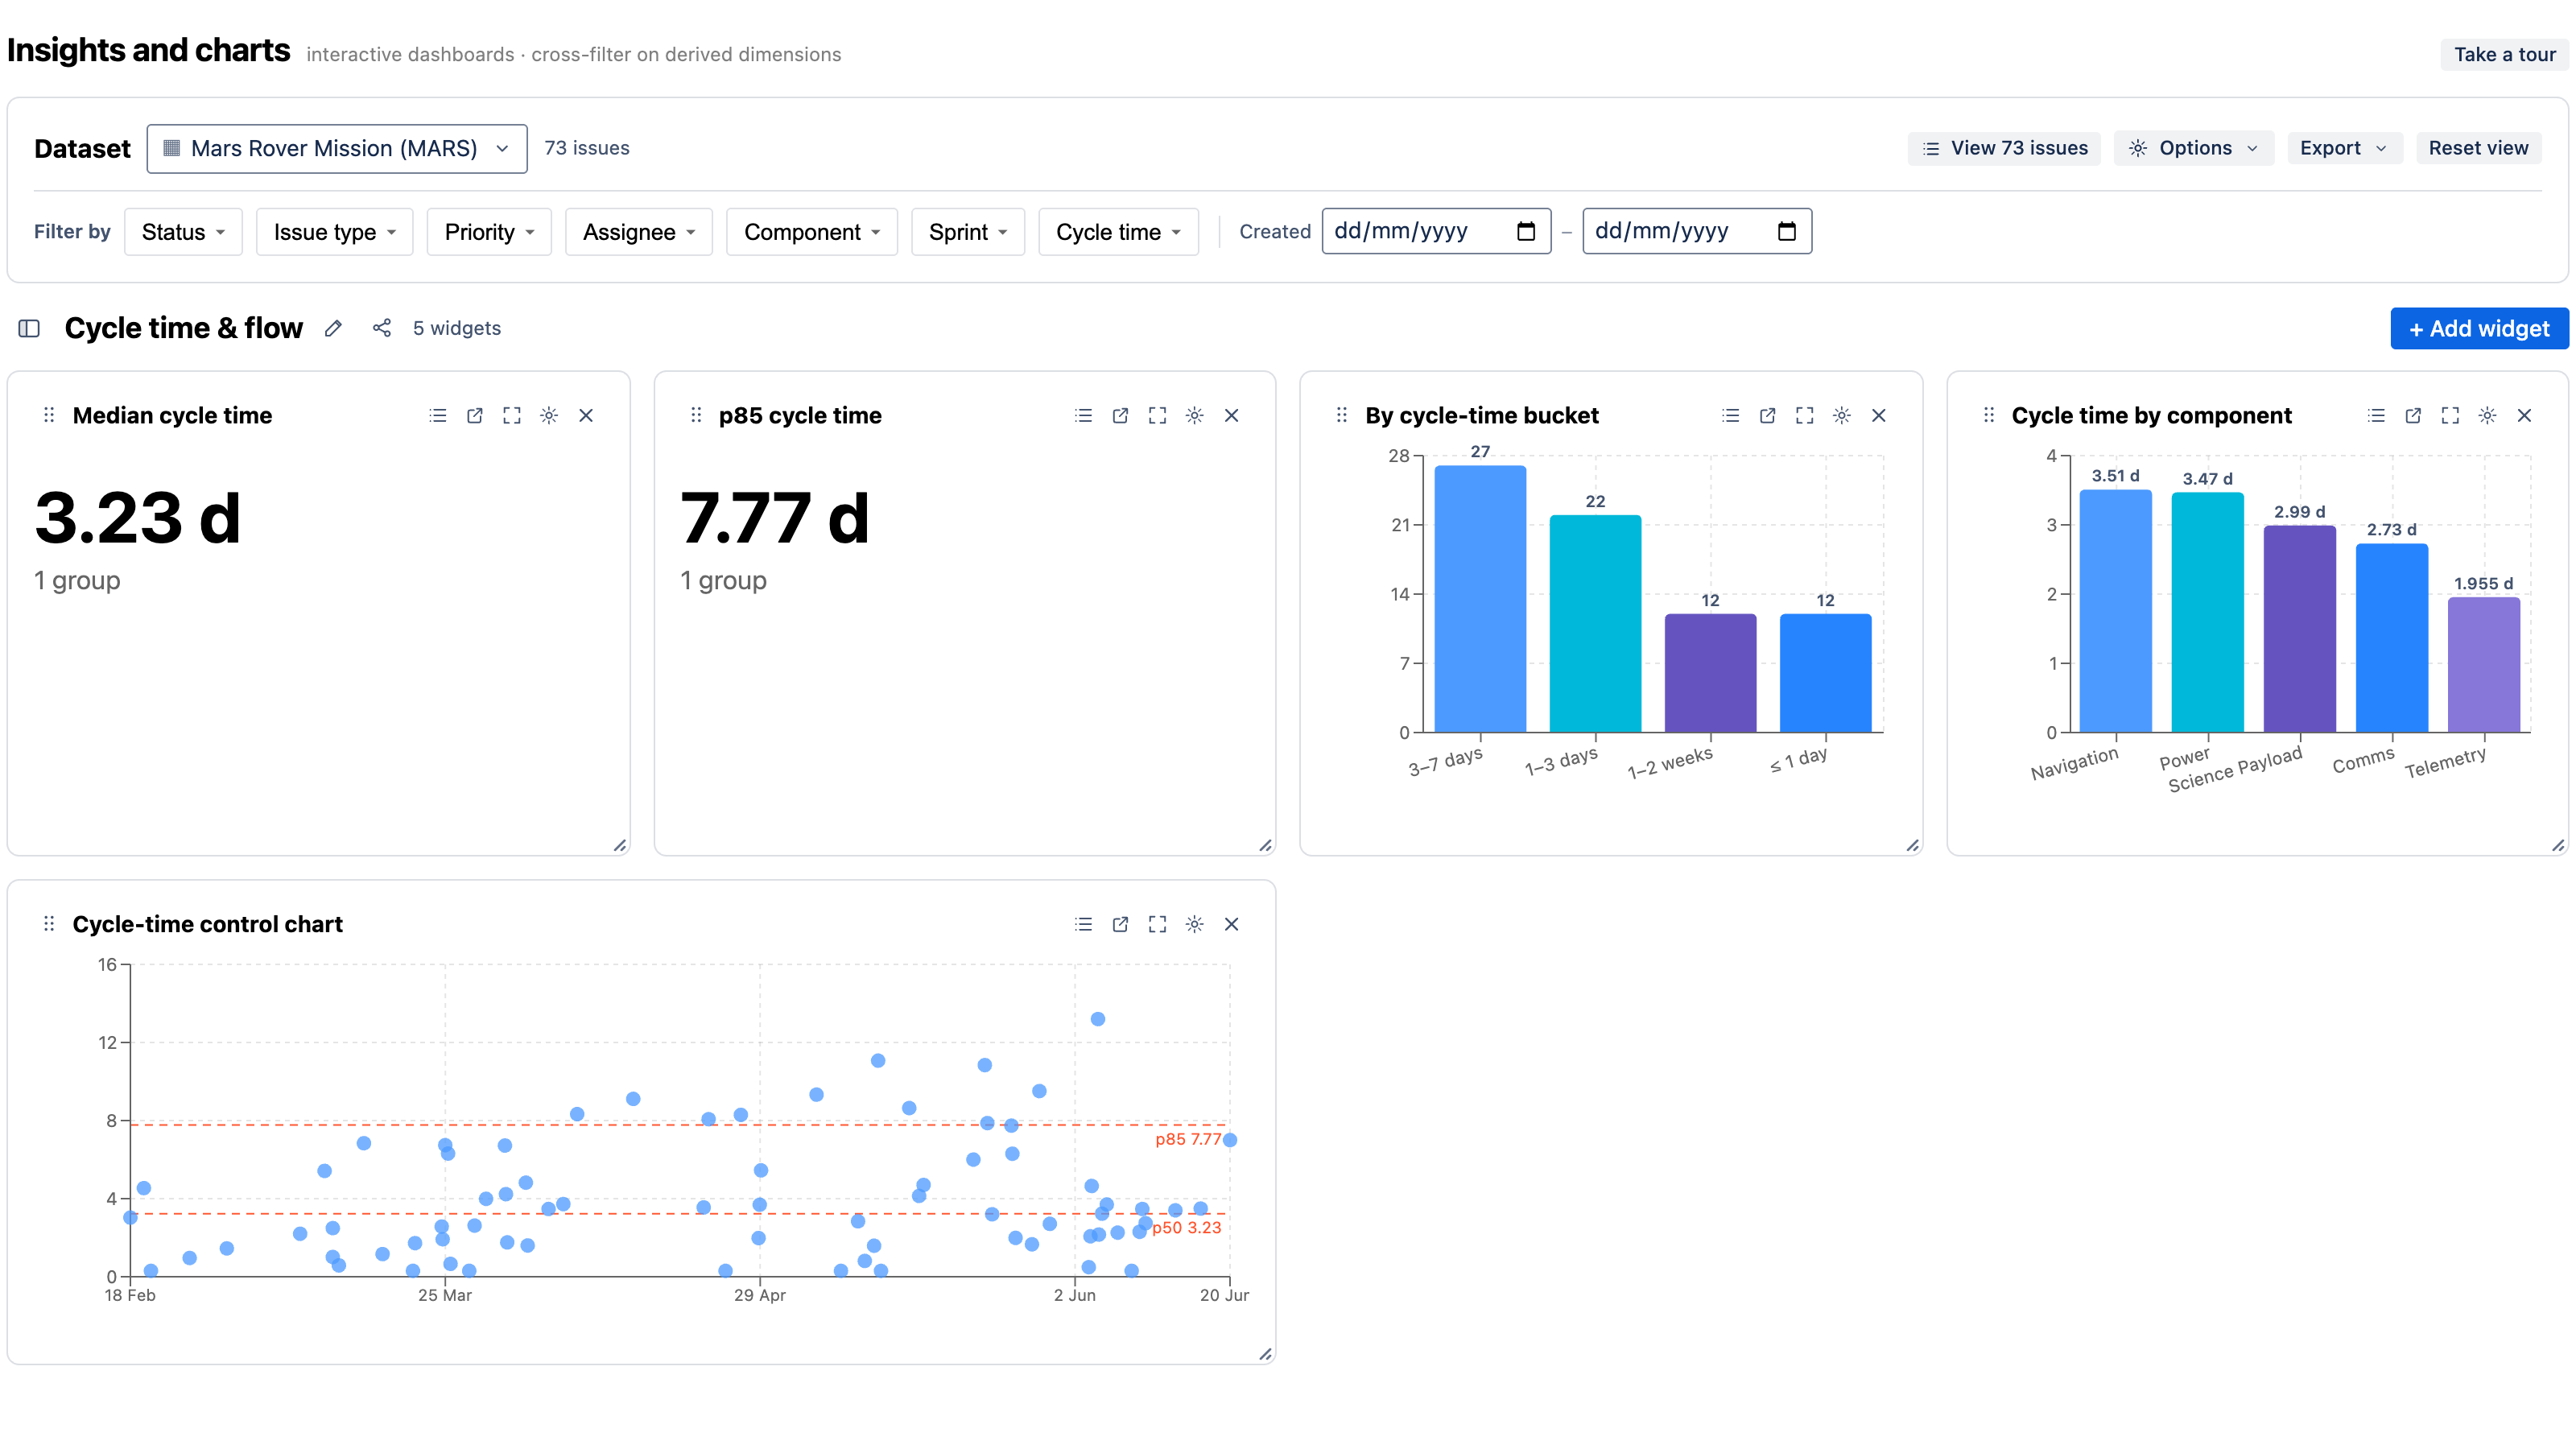
How long issues took to complete. Available as:
- a bucketed dimension (cycle-time bucket) for a distribution bar/pie,
- a measure — median, p75/p85/p90 cycle-time days — for KPIs, and
- the control chart (a scatter of resolved date × cycle time with percentile lines). See Chart types.
Time in status
How long issues spend in each status — the flagship "where does work wait?" metric. Chart the average time in status across the workflow.
WIP / status aging
How long issues have sat in their current status (status-age bucket). Surfaces stale in-progress work that simple counts hide.
SLA state
Against a target you set (in Options → SLA target), each issue is within or breached. Use it for a "% within SLA" KPI, a breach count, or SLA state grouped by priority.
Reopen count
How many times an issue moved backwards in the workflow — a quality signal that's invisible to a current-state count.
Flow history (state-by-day)
From the daily snapshots:
- Open issues over time — the unresolved backlog day by day.
- Cumulative Flow Diagram (CFD) — issue count per status per day, as a stacked area.
Velocity & sprint burndown
From a board dataset and Jira's agile API:
- Velocity — committed vs. completed points per sprint.
- Sprint burndown — remaining work vs. the ideal line within a sprint.
Put them to work
Every derived metric above ships as a one-click recipe in a matching template — Cycle time & flow, Time in status & WIP, SLA & aging, Flow history (CFD), Velocity & burndown. See Templates & recipes.